Add and remove layers
Before you can place shapes or objects on a map, you need to add one or more layers.
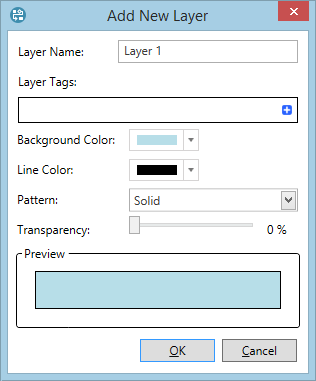
To add a layer, click the Add button 

| Field | Description |
|---|---|
| Layer Name | Names can contain up to 50 alphanumeric characters (special characters are not allowed). When you create a layer, it will be given a default name. |
| Layer Tags | Map Layer Tags are used to make layers visible in the Dashboard Map; the layers can be organized using Map Layer Tag Groups. See Map layer tags for more information. You can assign the same tag to multiple layers. Map Layer Tags are created and managed in the Dataflow Configuration workspace: see Dashboard Map configuration (Map Layer Tag groups) and Tags. |
| Background Color | Color of shapes, such as polygons, that are placed on the layer. |
| Line Color | Color of lines and the borders of shapes, such as polygons, that are placed on the layer. |
| Pattern | Coloring pattern for shapes placed on the layer. |
| Transparency | Transparency of shapes placed on the layer. |
| Preview | This field shows a preview of the final appearance based on the above settings. |
Delete a layer
To delete a layer, click the Delete button  in the Map tab on the ribbon.
